

The Department of Transport noticed a concerning pattern of fluctuating road accident rates across different regions and vehicle types. Despite a general decline in national casualties, policymakers lacked a unified analytical view to identify where, when, and why most accidents occurred.
As part of a road safety analytics initiative, the department commissioned an interactive Power BI dashboard to help understand the major contributors to accidents, monitor trends over time, and inform targeted safety interventions.
As a data analyst, my role was to design and implement a Road Accident Analysis Dashboard that could:
Consolidate accident and casualty data by vehicle type, road type, light conditions, and location.
Compare current year (CY) and previous year (PY) accident trends.
Provide geospatial visualization of accident hotspots across the UK.
Support evidence-based decisions for road safety policies and infrastructure planning.
Steps taken to achieve this;
Data Preparation and Cleaning
Integrated large datasets containing accident details (casualty type, vehicle class, road condition, time, and location) using Power Query.
Standardized categorical fields such as “Road Type,” “Light Condition,” and “Vehicle Type” for consistency.
Replaced missing weather and lighting data with mode imputation and validated geographical coordinates for accurate mapping.
Data Modeling and DAX Calculations
Created DAX measures to calculate:
Total CY Accidents (144.4K)
Total CY Casualties (195.7K)
Serious Casualties (27K)
Slight Casualties (165.8K)
Fatalities (2.9K)
Computed year-over-year percentage changes, highlighting performance improvements (e.g., -11.9% reduction in total casualties).
Dashboard Design and Visualization
Designed a multi-panel Power BI dashboard with:
KPI cards to summarize yearly totals and percentage changes.
Line charts to visualize casualty trends across months.
Donut charts to analyze accidents by light conditions, urban/rural split, and road type.
Bar charts to display vehicle-type distribution, revealing cars and motorcycles as key contributors.
A geo-spatial map displaying accidents by local authority, powered by Bing Maps integration.
Used color-coded themes (e.g., red for high-risk categories, blue for improvements) to ensure clarity and quick pattern recognition.
Optimization and Usability Enhancements
Added interactive filters for weather, road type, and year, enabling dynamic exploration.
Configured tooltips and slicers to support granular drill-downs (e.g., viewing accidents only under poor lighting or on single carriageways).
Validated results against national statistics to ensure analytical accuracy.
The final dashboard provided a single, data-driven interface that transformed static government records into an actionable road safety intelligence system.
Key Insights Derived:
195.7K casualties recorded in the current year, marking an 11.9% reduction compared to the previous year.
Cars (155,804 casualties) and motorcycles (15,610 casualties) were the major contributors to accidents, together accounting for over 85% of total casualties.
Urban areas represented 61.95% of total casualties, while rural areas made up 38.05%, indicating that city congestion is a higher risk factor than rural roads.
Single carriageways were the most dangerous road type, responsible for the majority of incidents, whereas roundabouts and one-way streets reported the fewest.
Dark lighting conditions accounted for 26.16% of casualties, suggesting a need for improved street lighting and nighttime visibility measures.
Fatal casualties decreased by 35.6%, showing progress in emergency response effectiveness and awareness campaigns.
Impact:
The dashboard allowed government analysts and policymakers to:
Identify regional accident hotspots and deploy road safety resources more effectively.
Recommend infrastructure improvements, such as better lighting and clearer road signage on single carriageways.
Develop targeted awareness programs for high-risk groups like motorcyclists and young urban drivers.
Track progress toward national road safety goals year-over-year.
Observation: There were 195.7K total casualties and 144.4K total accidents in the current year, showing an 11.9% and 11.7% decrease, respectively, compared to the previous year.
Interpretation: The reduction indicates that recent road safety measures, awareness campaigns, and enforcement initiatives are yielding positive results.
Actionable Steps:
Continue investing in driver safety education programs and speed monitoring systems.
Deploy data-led performance reviews of existing road safety policies to sustain the downward trend.
Focus future interventions on regions still showing high incident density (as identified in the geospatial map).
Observation: Serious casualties dropped by 16.2% to 27K, and fatalities fell sharply by 35.6% to 2.9K.
Interpretation: Improved emergency response time and enforcement of helmet/seatbelt laws are likely contributors.
Actionable Steps:
Strengthen partnerships with emergency response services to maintain quick dispatch times.
Conduct post-incident audits to understand why fatal cases still occur despite overall improvement.
Introduce smart traffic management systems at identified accident-prone intersections.
Observation:
Cars accounted for the majority of casualties (155,804 cases).
Motorcycles (15,610) and vans (15,905) were the next highest contributors, while buses (6,573) and agricultural vehicles (399) had minimal impact.
Interpretation: The concentration among private and commercial light vehicles suggests that urban congestion and driver behavior remain primary risk factors.
Actionable Steps:
Implement awareness programs for car and motorcycle drivers emphasizing lane discipline and speed compliance.
Encourage vehicle safety inspections for commercial vans to reduce mechanical failure–related incidents.
Deploy AI-based monitoring for high-density roads to track risky driving patterns.
Observation: Urban areas accounted for 61.95% of casualties, compared to 38.05% in rural zones.
Interpretation: The higher concentration in urban areas suggests that traffic congestion, pedestrian density, and intersection volume are major risk factors.
Actionable Steps:
Introduce adaptive traffic signals in urban hotspots to minimize sudden stops and collisions.
Increase pedestrian crossings and safety barriers in high-traffic city zones.
Promote public transport use to reduce overall vehicle volume in city centers.
Observation: Single carriageways had the highest casualty count, followed by dual carriageways, while roundabouts and slip roads had significantly fewer incidents.
Interpretation: Straight and long stretches without physical dividers encourage over-speeding and lane drifting.
Actionable Steps:
Install speed cameras and rumble strips on high-risk single carriageways.
Conduct infrastructure audits to identify poorly lit or poorly marked segments.
Encourage local councils to implement divided-lane designs where feasible.
Observation: Darkness accounted for 26.16% of casualties, while light conditions made up 73.84% of total incidents.
Interpretation: Despite fewer vehicles at night, visibility issues and fatigue-related accidents remain significant.
Actionable Steps:
Upgrade street lighting and reflective road signage in rural and semi-urban areas.
Educate drivers about the risks of nighttime driving fatigue.
Use IoT-based light sensors to optimize brightness in accident-prone zones.
Observation: The map visualization shows dense clusters of accidents in urban corridors like Manchester, Birmingham, and London, as well as along major highway intersections.
Interpretation: Population density and traffic volume correlate strongly with accident frequency.
Actionable Steps:
Prioritize funding and enforcement in top-10 accident-heavy local authorities.
Launch data-sharing partnerships between councils and emergency services to coordinate faster response.
Implement AI-based predictive analytics to forecast accident probability by road and season.
Observation: The line graph comparing CY vs. PY casualties shows a visible decline across most months, except for minor spikes in June and October.
Interpretation: Seasonal weather shifts and increased travel periods (summer holidays and year-end) influence risk levels.
Actionable Steps:
Prepare seasonal safety campaigns ahead of peak travel months.
Deploy temporary traffic management controls (e.g., mobile barriers or variable message signs) during these periods.
Evaluate annual performance metrics using this dashboard to measure improvement.
| Focus Area | Key Insight | Recommended Action |
|---|---|---|
| Overall Trend | Casualties dropped by 11.9% | Maintain policy enforcement and awareness initiatives |
| Vehicle Risk | Cars and motorcycles cause 85% of incidents | Target driver behavior and commercial fleet safety |
| Location Type | 62% of accidents in urban areas | Improve traffic signal coordination and pedestrian safety |
| Road Type | Single carriageways most dangerous | Install dividers, speed control, and safety markings |
| Lighting | 26% of casualties at night | Upgrade lighting infrastructure and driver awareness |
| Geography | Clusters in major cities | Focus funding and predictive modeling on hotspots |
The video succinctly showcases the Road Accident Insights Dashboard for 2021–2022 by first animating its core KPI cards (total casualties, total accidents and severity deltas), then demonstrating how vehicle‑type bars, dual‑year monthly trend lines, road‑type and urban/rural breakdowns, light‑condition slices and weather filters all update instantaneously. It finishes with an interactive map of accident and casualty hotspots—complete with drill‑through pop‑ups—and a brief call to action to use these insights for targeted safety interventions.
Users are encouraged to make full use of the embedded dashboard to explore and interact with its features. The dashboard has been designed for hands-on testing, allowing users to apply filters, use slicers, reset selections with the “Clear All” button, and navigate using bookmarks. This interactive experience helps users better understand the data, test various scenarios, and evaluate the dashboard’s functionality in a real-time environment.
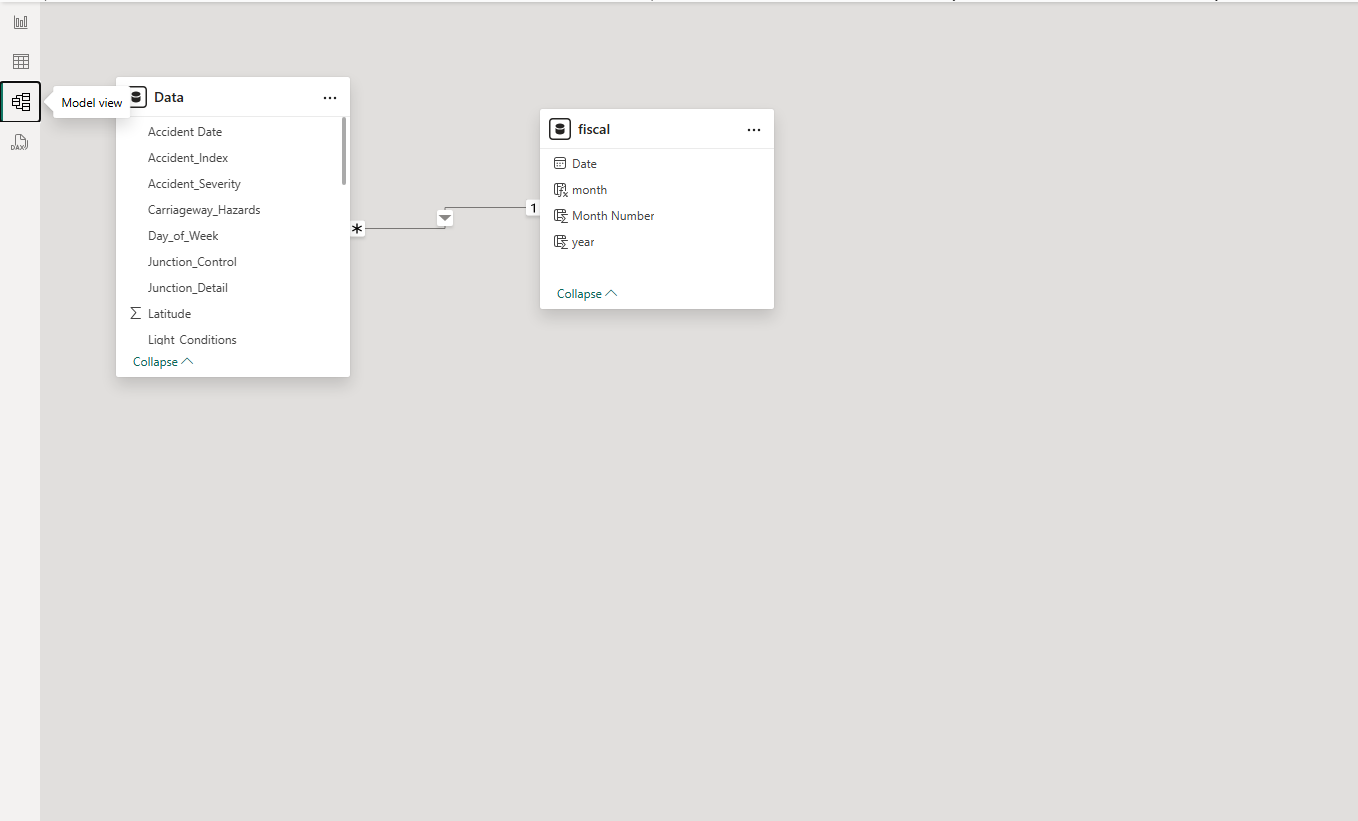
In order to support robust time‑based analysis and to align reporting with the client’s July 1 – June 30 fiscal cycle, a dedicated Fiscal Date dimension was designed and linked to the primary accident fact table via a one‑to‑many relationship on the shared date key.
Common Key Definition
Each accident record carries a “DateKey” value derived directly from its raw Accident Date timestamp. The Fiscal Date table exposes this same DateKey as its primary key, along with a comprehensive set of calendar attributes—Calendar Year, Calendar Month, Fiscal Year, Fiscal Month Number, Fiscal Quarter and a concatenated “Fiscal Period” label (for example, “2022‑M01” for July 2021).
Relationship Configuration
The data model enforces a single‑directional, one‑to‑many relationship from the Fiscal Date dimension (the “one” side) to the accident fact table (the “many” side). This configuration ensures that any filter applied to the Fiscal Date table—whether through slicers, axis hierarchies or time‑intelligence functions—propagates precisely to the matching subset of accident rows, without risk of circular dependencies or ambiguous filter flow.
Enabling Fiscal Time Intelligence
By centralizing all time‑related attributes in the Fiscal Date table, measures such as year‑to‑date sums, month‑over‑month comparisons and year‑over‑year growth ratios can be expressed simply in DAX (TOTALYTD, SAMEPERIODLASTYEAR, etc.) against the dimension’s fields. The underlying relationship automatically scopes each calculation to the correct span of accident data—whether the user is viewing January, the first fiscal quarter, or a custom date range.
Benefits and Governance
This modeling approach keeps the fact table lean—storing only the raw timestamp—while housing every reporting‑relevant date attribute in a single, managed dimension. It eliminates redundant date logic in individual measures, reduces the chance of misaligned period filters, and provides a consistent, auditable source of truth for all calendar and fiscal reporting needs.
Data Preparation
Ingestion: Aggregated raw incident records from multiple sources.
Cleansing: Removed duplicates, standardized categorical values, and validated date/time and location fields.
Enrichment: Generated a fiscal calendar (July 1–June 30) and appended geographic lookup attributes (e.g., local authority, urban/rural flag).
Data Modeling
Created a central fact table for collision events, retaining key metrics (date, location, severity, casualty count).
Built dimension tables for Date (with fiscal periods), Vehicle Type, Severity Category, and Location.
Defined one‑to‑many relationships from each dimension to the fact table to enable precise filtering and aggregation.
Measure Development (DAX)
Core Metrics: Total collisions, total casualties, and year‑over‑year change.
Segmentation: Casualty breakdowns by severity and vehicle type using CALCULATE with appropriate filters.
Time Intelligence: Fiscal‑period comparisons via TOTALYTD, SAMEPERIODLASTYEAR, and min/max highlighting across selected periods.
Report Design & Visualization
KPI Cards: Display headline figures with conditional formatting for YoY deltas.
Trend Analysis: Dual‑line charts comparing monthly casualties across current and prior years, with markers on peak and trough points.
Segment Charts: Bar and donut charts for road type, urban vs. rural, and light‑condition comparisons.
Geospatial Map: Interactive map highlighting accident hotspots, with tooltips and drill‑through details.
Interactive Filters: Slicers for fiscal period, vehicle category, road surface, light, and weather conditions, enabling on‑the‑fly scenario analysis.
Deployment & Handover
Published to Power BI Service with scheduled data refresh and row‑level security configured by user role.
Delivered a concise user guide and conducted a knowledge‑transfer session to ensure smooth adoption.
Emmanuel Olorunda
Copyright © 2025 | All Rights Reserved
Every project starts with a chat, Emmanuel is keen to conversation and open to discussing your project. he will pull in the right expertise when needed