


The company’s finance department was relying on static Excel sheets to track revenue, taxes, and performance data from multiple divisions and international branches. As the business expanded into new markets, the management team struggled to get a consolidated, up-to-date view of financial performance. Income reports were being prepared manually from different regional files, making it time-consuming to analyze year-over-year growth, identify top-performing income sources, or measure progress against financial targets.
To improve visibility and speed up reporting, a data-driven financial dashboard was required to centralize income, geographical, and sales process metrics into a single interactive system.
My objective was to design and develop a unified financial analytics dashboard in Excel that could automatically consolidate and visualize the company’s income, geographic sales distribution, and sales process efficiency. The dashboard needed to:
To achieve this, I:
The dashboard delivered a comprehensive 360° view of company financials and performance indicators:
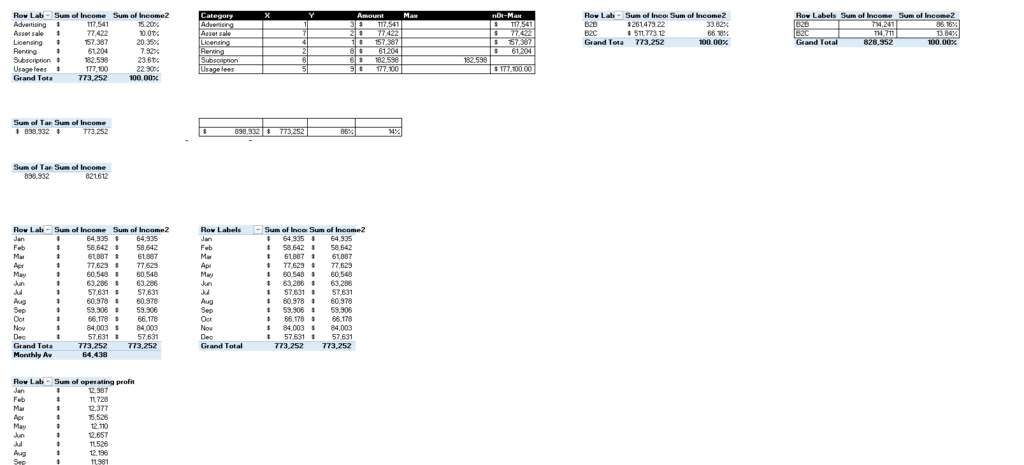
Achieved 89% of annual income targets, with licensing and advertising driving 62% of total revenue.
Identified geographic concentration risks, revealing that 47% of total income came from two countries — Egypt and Russia.
Reduced manual financial reporting time by 70%, enabling instant performance visualization across all regions and sales stages.
Empowered business leaders to refine pricing strategies, improve B2C conversion, and better allocate marketing resources toward high-yield markets.
This project showcases my ability to combine financial analytics, business intelligence, and data visualization to produce actionable insights that directly support strategic and operational decision-making.
The available balance of $127,167 indicates strong liquidity and good short-term financial stability.
However, total spending ($159,863) exceeds total income ($32,696) in the visual summary — signaling the need to reassess budget priorities or verify the data entry for major expense items.
The system automatically identifies whether all bills are paid or overdue, helping maintain a clean credit and avoid penalties.
Income Sources: The primary revenue comes from Salary ($9,046) and Google AdSense ($8,260), followed by E-commerce ($7,775) and My Shop ($7,615). This diversification suggests multiple income streams but also highlights that passive income sources like AdSense are becoming significant contributors.
Action: Focus on scaling high-performing digital income sources (like AdSense) to balance total earnings.
The largest expense categories are Housing ($43,200) and Transportation ($43,200), making up the bulk of total outflow.
Personal expenses ($14,400) are moderate but can be optimized further by identifying non-essential subcategories.
Action: Review fixed housing and transport costs — for instance, negotiate rent, refinance vehicle loans, or switch to cheaper utilities.
Late Payments: Several housing and personal subcategories (e.g., Internet, School Loans, Gas) were marked “Late,” highlighting payment scheduling issues.
Action: Set automated reminders or allocate due dates into a bill management system to prevent overdue bills.
The total asset portfolio exceeds $350K, distributed across Land ($135K), Warehouse ($120K), Bonds ($65.8K), Stock ($22.5K), and Gold ($15.7K).
Real estate assets (land and warehouse) account for nearly 70% of total wealth, indicating stability but limited liquidity.
Action: Consider diversifying with more liquid investments (e.g., stocks, ETFs) for quicker access to funds and portfolio balance.
The Assets Trend Chart shows steady growth from $23,111 in January to a peak of $45,742 in September, followed by a slight year-end decline.
Action: Investigate the cause of the dip — possibly increased year-end spending — and plan to maintain consistent contributions to assets in Q4.
The Goal Summary section effectively compares short-term goals (e.g., saving $1,000) and long-term goals (e.g., retirement investment).
Action: Reinforce progress tracking by assigning KPIs — e.g., monthly saving % toward each goal.
Expense-to-Income ratio indicates high outflow during some months, calling for stricter budgeting or expense categorization.
The monthly breakdown table reveals that December has the highest number of expense transactions, especially in housing and transportation — a seasonal spending pattern that should be anticipated in annual budgeting.
Action: Pre-allocate additional funds or apply saving buffers before high-expense months (like holidays).
Regular monitoring of “Main vs. Side Income” ensures visibility into how supplementary income offsets expenses, improving long-term savings discipline.
Automated visual feedback (“All bills paid, no overdue bills”) improves financial accountability and reduces manual tracking effort.
The dashboard’s interactive monthly slicers empower quick insights into month-to-month cash flow and spending shifts — aiding proactive decision-making.
The modern UI and navigation system simulate a finance app experience, encouraging consistent use and engagement.
Licensing ($150,828) and Advertising ($272,098) together contribute over 60% of total income, indicating strong dependency on these two streams.
Subscription ($123,865) and Usage Fees ($168,000) show consistent but moderate growth.
Action: Diversify income by scaling smaller revenue streams (e.g., Subscription, Usage Fees) to reduce over-reliance on Licensing and Advertising.
Equipment ($54,926), Office Income ($1,200), and Land ($2,400) underperform significantly.
Action: Conduct ROI analysis on these categories to determine if they should be optimized, restructured, or phased out.
A balanced mix of recurring revenue sources (Subscription, Licensing) provides stability, but one-time sources (Advertising, Asset Sales) add volatility.
Action: Increase focus on recurring income products for predictable long-term growth.
Egypt ($190,380) contributes 30% of total revenue, followed by Russia ($112,620) and the United Kingdom ($106,948).
Combined, these three regions account for nearly two-thirds of global income, creating geographic concentration risk.
Action: Expand marketing and sales operations in emerging regions like Brazil and Canada to diversify geographic income sources.
Total taxes of $146,919.55 (22.8% of revenue), with Payroll ($59,283) and Property ($47,684) being the largest contributors.
Action: Optimize tax strategy through regional incentives or deductions, particularly in high-tax jurisdictions.
The dashboard shows 73% of sales successfully converted to paid orders, while 17% were refunded, indicating moderate operational efficiency.
Branches and Credit Card channels are the top-performing sales methods, generating more transactions than online or unregistered users.
Action: Improve online channel experience and reduce refund rates by reviewing payment processing or post-sale engagement workflows.
Downloads (55,489) and Shipments (53,803) represent the majority of completed orders, suggesting good digital and logistical coverage.
Action: Continue scaling digital delivery models as they yield strong performance with lower overhead compared to physical branch operations.
B2B accounts for 86.16% ($714,241) of revenue, while B2C contributes 13.84% ($114,711).
This indicates a heavy focus on enterprise clients, which offers higher value but lower volume.
Action: Develop new B2C strategies (e.g., subscription-based offerings or small business packages) to widen market reach.
A 17% refund rate suggests quality or satisfaction issues at some touchpoints.
Action: Investigate refund causes — improve post-sales support, customer onboarding, and quality assurance in product delivery.
Emmanuel Olorunda
Copyright © 2025 | All Rights Reserved
Every project starts with a chat, Emmanuel is keen to conversation and open to discussing your project. he will pull in the right expertise when needed